PRONAF Investment Analysis
Geospatial Evaluation of Agricultural Loans in Brazil

Project Overview
This project analyzes the National Program for Family Agriculture (PRONAF) loans across Brazil from 2013-2024.
- Comprehensive evaluation of R$64 billion (in 2024) in agricultural loans
- Geospatial analysis at national, regional, and municipal levels
- Interactive RShiny dashboard
- Focused analysis of specific product investments
Tools Used
- R (tidyverse, sf)
- RShiny for interactive dashboard
- Geospatial analysis (leaflet, geobr)
- Data visualization (ggplot2)
- Public policy evaluation frameworks
Data Collection & Cleaning
Processed raw data from Brazilian Central Bank (2025):
- API-collected loan records
- Standardized values across 12-year period (2013-2025)
- Geocoded municipality-level data
- Filtered and validated 3.6M+ records
Geospatial Visualization
Advanced mapping techniques:
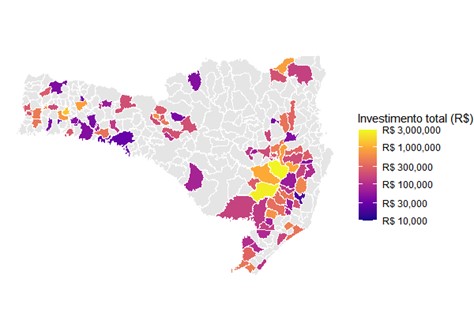
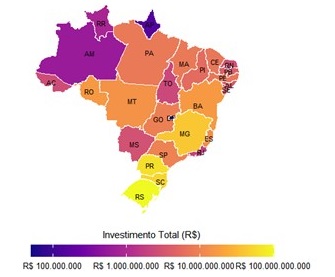
- Interactive choropleth maps by state/municipality
- Regional comparison dashboards
- Special focus on Santa Catarina tourism investments
- Animated time-series maps
Interactive Dashboard
RShiny application features:
- Dynamic filtering by year, region, and program
- Loan value and number of contracts distribution analysis
- Comparative benchmarking tools
Dashboard Usage Demonstration
Key Policy Insights
Regional Disparities
Southeast received 3.2x more funding than North region
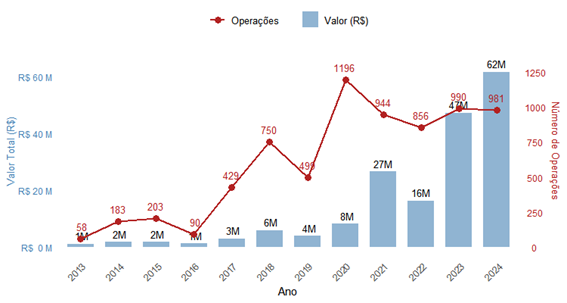
Tourism Growth
Rural tourism loans increased from R$1M to R$62M (2013-2024)
Santa Catarina Focus
32 municipalities received tourism-specific investments